Test Taking
Many high school students across the United States take the ACT in preparation for college.
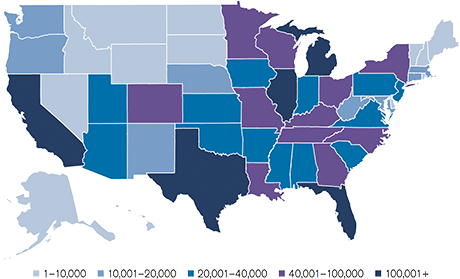
Map reads: In Florida, more than 100,000 students from the high school graduating class of 2013 took the ACT.
Number of ACT-Tested High School Graduates, 2013
| State | Number of ACT-Tested High School Graduates |
|---|---|
| Alabama | 20,001–40,000 |
| Alaska | 1–10,000 |
| Arizona | 20,001–40,000 |
| Arkansas | 20,001–40,000 |
| California | 100,001 or more |
| Colorado | 40,001–100,000 |
| Connecticut | 10,001–20,000 |
| Delaware | 1–10,000 |
| District of Columbia | 1–10,000 |
| Florida | 100,001 or more |
| Georgia | 40,001–100,000 |
| Hawaii | 1–10,000 |
| Idaho | 1–10,000 |
| Illinois | 100,001 or more |
| Indiana | 20,001–40,000 |
| Iowa | 20,001–40,000 |
| Kansas | 20,001–40,000 |
| Kentucky | 40,001–100,000 |
| Louisiania | 40,001–100,000 |
| Maine | 1–10,000 |
| Maryland | 10,001–20,000 |
| Massachusetts | 10,001–20,000 |
| Michigan | 100,001 or more |
| Minnesota | 40,001–100,000 |
| Mississippi | 20,001–40,000 |
| Missouri | 40,001–100,000 |
| Montana | 1–10,000 |
| Nebraska | 10,001–20,000 |
| Nevada | 1–10,000 |
| New Hampshire | 1–10,000 |
| New Jersey | 20,001–40,000 |
| New Mexico | 10,001–20,000 |
| New York | 40,001–100,000 |
| North Carolina | 40,001–100,000 |
| North Dakota | 1–10,000 |
| Ohio | 40,001–100,000 |
| Oklahoma | 20,001–40,000 |
| Oregon | 10,001–20,000 |
| Pennsylvania | 20,001–40,000 |
| Rhode Island | 1–10,000 |
| South Carolina | 20,001–40,000 |
| South Dakota | 1–10,000 |
| Tennessee | 40,001–100,000 |
| Texas | 100,001 or more |
| Utah | 20,001–40,000 |
| Vermont | 1–10,000 |
| Virginia | 20,001–40,000 |
| Washington | 10,001–20,000 |
| West Virginia | 10,001–20,000 |
| Wisconsin | 40,001–100,000 |
| Wyoming | 1–10,000 |
- 1,799,243 students from the high school graduating class of 2013 took the ACT.
- Just over half (52%) of all ACT-tested high school graduates live in 9 states: CA, CO, FL, IL, MI, NC, OH, TN, and TX.
- Of the 9 states with the most ACT-tested high school graduates, 5 states (CO, IL, MI, NC, and TN) administered the ACT statewide to all public high school 11th graders.
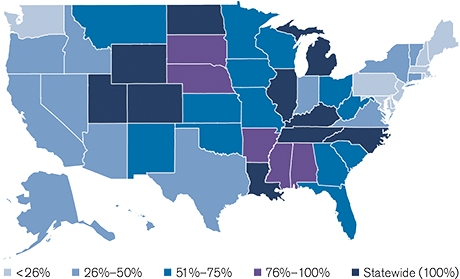
Map reads: In Texas, 26%–50% of the high school graduating class of 2013 took the ACT.
Percent of High School Graduates Who Took the ACT, 2013
| State | Percent Who Took the ACT |
|---|---|
| Alabama | 76%–100% |
| Alaska | 26%–50% |
| Arizona | 26%–50% |
| Arkansas | 76%–100% |
| California | 26%–50% |
| Statewide | Statewide (100%) |
| Connecticut | 26%–50% |
| Delaware | 25% or less |
| District of Columbia | 26%–50% |
| Florida | 51%–75% |
| Georgia | 51%–75% |
| Hawaii | 26%–50% |
| Idaho | 26%–50% |
| Illinois | Statewide (100%) |
| Indiana | 26%–50% |
| Iowa | 51%–75% |
| Kansas | 51%–75% |
| Kentucky | Statewide (100%) |
| Louisiana | Statewide (100%) |
| Maine | 25% or less |
| Maryland | 25% or less |
| Massachusetts | 25% or less |
| Michigan | Statewide (100%) |
| Minnesota | 51%–75% |
| Mississippi | 76%–100% |
| Missouri | 51%–75% |
| Montana | 51%–75% |
| Nebraska | 76%–100% |
| Nevada | 26%–50% |
| New Hampshire | 25% or less |
| New Jersey | 25% or less |
| New Mexico | 51%–75% |
| New York | 26%–50% |
| North Carolina | Statewide (100%) |
| North Dakota | Statewide (100%) |
| Ohio | 51%–75% |
| Oklahoma | 51%–75% |
| Oregon | 26%–50% |
| Pennsylvania | 25% or less |
| Rhode Island | 25% or less |
| South Carolina | 51%–75% |
| South Dakota | 76%–100% |
| Tennessee | Statewide (100%) |
| Texas | 26%–50% |
| Utah | Statewide (100%) |
| Virginia | 26%–50% |
| Vermont | 26%–50% |
| Washington | 25% or less |
| West Virginia | 51%–75% |
| Wisconsin | 51%–75% |
| Wyoming | Statewide (100%) |
Related Links
- Nationally, more than half (54%) of all students from the high school graduating class of 2013 took the ACT.
- High school graduates in 10 states (CO, IL, KY, LA, MI, NC, ND, TN, UT, and WY) participated in a statewide administration of the ACT during 11th grade.
- Several states, including CA, NY, and TX, had both a sizable number of ACT-tested high school graduates and a relatively low ACT participation rate.