The College Readiness of ACT-tested High School Graduates
As a national leader in assessment, research, and data, ACT releases its annual snapshot of the 2022 ACT-tested graduating class. Use the data visualization tool and resources below to examine students’ college and career readiness relative to the ACT College Readiness Standards and Benchmarks.
U.S. High School Class of 2022 Graduating Class Data
Context matters for the graduating class of 2022. This cohort endured the effects of a global pandemic spanning across the three years of their education: sophomore, junior, and senior years. ACT puts forth this data, in addition to our extensive COVID-19 related research, to ensure that school systems and states can make informed decisions that will improve outcomes for their students and families. ACT uses a holistic view and our consistent and reliable historical information to provide greater context and visibility as educators make critical decisions for future cohorts of students.
Highlights From This Year’s Data
- Approximately 1.3 million students in the U.S. high school graduating class of 2022 took the ACT test, an estimated 36 percent of graduates nationwide.
- The national average Composite score for the graduating class of 2022 is 19.8, down from 20.3 for the graduating class of 2021, the lowest average score since 1991.
- Thirty-five percent of the ACT-tested graduating class took the ACT more than once, as compared to 32% for the 2021 cohort.
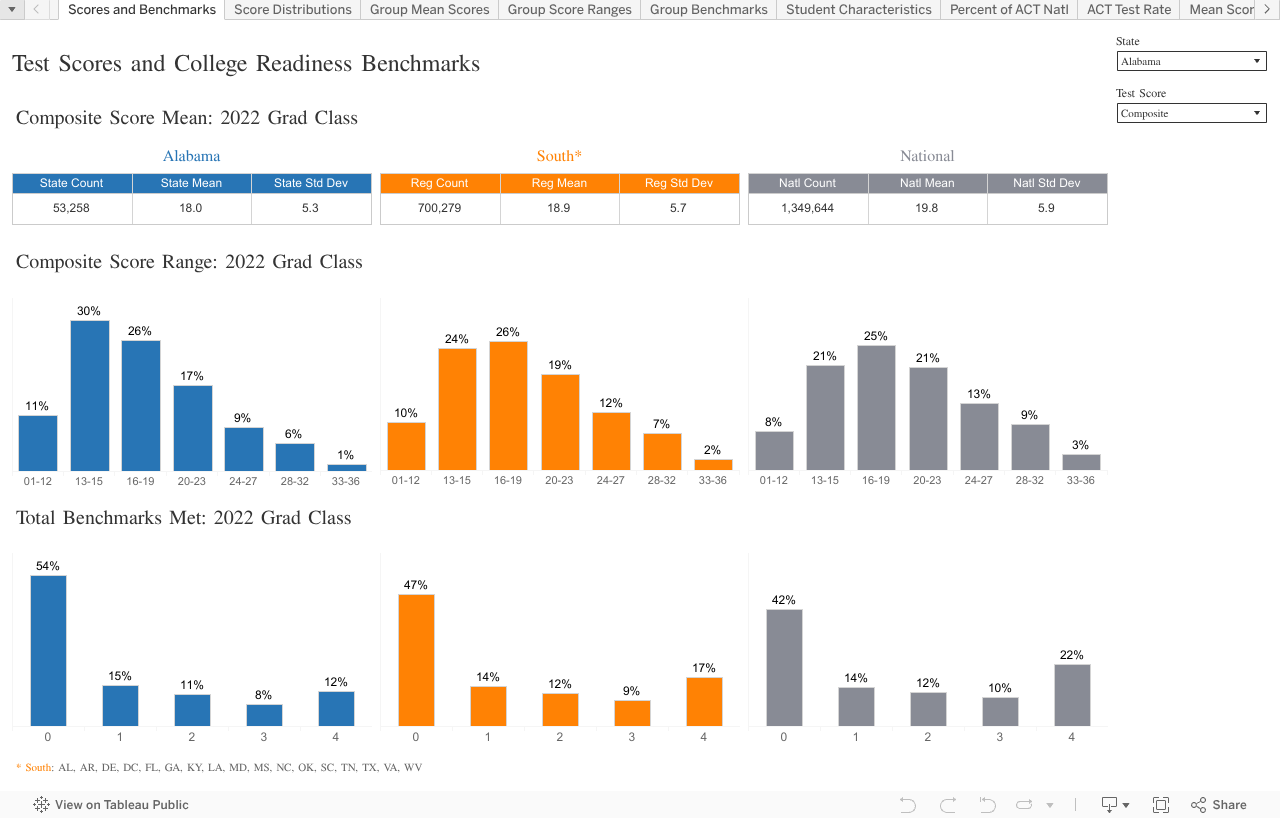
- Thirty-two percent of ACT-tested graduates in the class of 2022 met at least three out of four ACT College Readiness Benchmarks (English, reading, math, and science), while, 42% of students met none of the ACT College Readiness Benchmarks and 22% met all four ACT College Readiness Benchmarks.
- A record number of students in this cohort took the ACT as part of state and district school-day testing—16 states tested more than 75% of their students—providing students the opportunity to earn college-reportable ACT scores by taking the test in their own classrooms during regular school hours on a weekday and allowing states to receive a clearer understanding of how their school districts are performing.
Data Visualization Tool
The visualization tool below allows users to view multiple measures of college readiness for members of the high school graduating class of 2022 who took the ACT, summarized by state. Regional and national summaries for each measure of college readiness are also provided for additional context.
The interactive tool contains multiple views for exploring the data, using the tabs at the top. The "Scores and Benchmarks" tab provides the mean and standard deviation for each ACT test score, the distribution of students across score ranges that align with the ACT College Readiness Standards, and the share of students meeting the respective ACT College Readiness Benchmark. The "Score Distributions" tab provides the number and share of students scoring at each point on the score scale for each ACT test score. The "Group Mean Scores", "Group Score Ranges", and "Group Benchmarks" tabs provide the same summary information found in the "Scores and Benchmarks" tab by various student characteristics. Select a state, ACT test score and student characteristic (if applicable) to get started.
Interpretation of these summary measures of the college readiness of ACT-tested graduates by geographic entity will differ by the number, share, and composition of high school graduates taking the ACT. To assist users with interpretation, the tool also contains comparative information on the number, share, and characteristics of ACT-tested high school graduates. See the "Student Characteristics", "Percent of ACT Natl", "ACT Test Rate", and "Mean Score by Test Rate" tabs for this additional context.
For information about accessing this tool using a keyboard, please see the dashboard help page.
Note: ACT advises discretion when comparing dissimilar populations. Learn about nuances for interpreting the data.
Explore Additional Datasets
- Year-to-Year Average ACT Composite Score Changes
- ACT Composite and ACT Superscore Score Distributions
- Career Pathway Opportunities
- Industry Sector Benchmarks and Wages
- Enrollment, Retention, and Transfer Behaviors
Need Help Putting ACT Data to Work?
You can learn more about how to use ACT insights at your school—and find solutions to your challenges—during our annual ACT College and Career Readiness Workshops. These events are available in your region and many of them present state-specific information, as well as tools and best practices presented by ACT experts.
