ACT-tested Class of 2025 Demonstrates Readiness for College and Career Success
The annual ACT Graduating Class Release provides a trusted snapshot of the college and career readiness demonstrated by the nation’s most recent ACT-tested high school graduates. The data visualization tool and resources provided as part of this annual release allow parents, educators, employers, researchers, and policymakers to examine the readiness of the 2025 cohort of ACT-tested students relative to the ACT College Readiness Standards and Benchmarks.
U.S. High School Class of 2025 Graduating Class Data
ACT’s annual graduating class data release provides:
- Trusted information that local and state education leaders can use to make informed decisions to better serve students and families.
- Reliable data that post-secondary education leaders can use to help first-time enrolled students to succeed.
- Key insights helping employers understand what the annual class of ACT-tested high school graduates are ready to do if they choose a path directly into the workforce.
This year’s graduating class data reflect the test scores and benchmark attainment rates for all 2025 U.S. graduates who took the ACT test at least once in the 10th, 11th, or 12th grade. The data represent the most recent test taken by each student.
ACT test scores and benchmark attainment are consistent predictors of postsecondary outcomes, including first-year retention and graduation rates. Read the 2025 Graduating Class Executive Summary.
Key Findings From This Year’s Data
- Almost 1.4 million 2025 high school graduates – about 36% of the full U.S. graduating class – took the ACT at least once between their sophomore and senior years.
- 1.1 million of those students — 81% of all ACT-tested graduates — took the test at least once through school-day testing.
- 23 states and hundreds of districts provided the ACT through school-day testing.
- 15 states tested 90% or more of their 2025 graduates.
- 30% of the 2025 ACT-tested graduating class met at least three ACT College Readiness Benchmarks. Those students are twice as likely to enter college directly after high school and they are twice as likely to earn an undergraduate degree in a timely manner, compared to students who do not meet any benchmarks.
- The national average Composite score was 19.4.
- Among the 34% of graduates who took the ACT two or more times, students improved their ACT Superscore by an average of 2.4 points. The ACT Superscore allows students to present their best section test scores to colleges for admission, scholarships, and course placement.
- More than 847,000 ACT-tested graduates in the Class of 2025 would likely have earned Silver or higher-level National Career Readiness Certifications via the ACT WorkKeys test, demonstrating foundational essential skills associated with most U.S. jobs.
School-Day Testing
School-day testing provided by states and districts reduces barriers and provides school leaders with a more representative view of college and career readiness as compared to test data that are limited to students who opt into national ACT testing – most often on Saturday mornings at their own expense. Many school systems also use school-day ACT assessments to eliminate other testing used for state and federal accountability.
Access Your Profile Report
ACT provides school and district-level profile reports at no cost to K-12 institutions whose 2025 graduates took the ACT. If you’re a school or district educator or administrator, you can now access a PDF copy of your 2025 graduating class profile report through ACT Online Reporting, or you can request those from ACT. Visit the ACT Online Reporting page to get started.
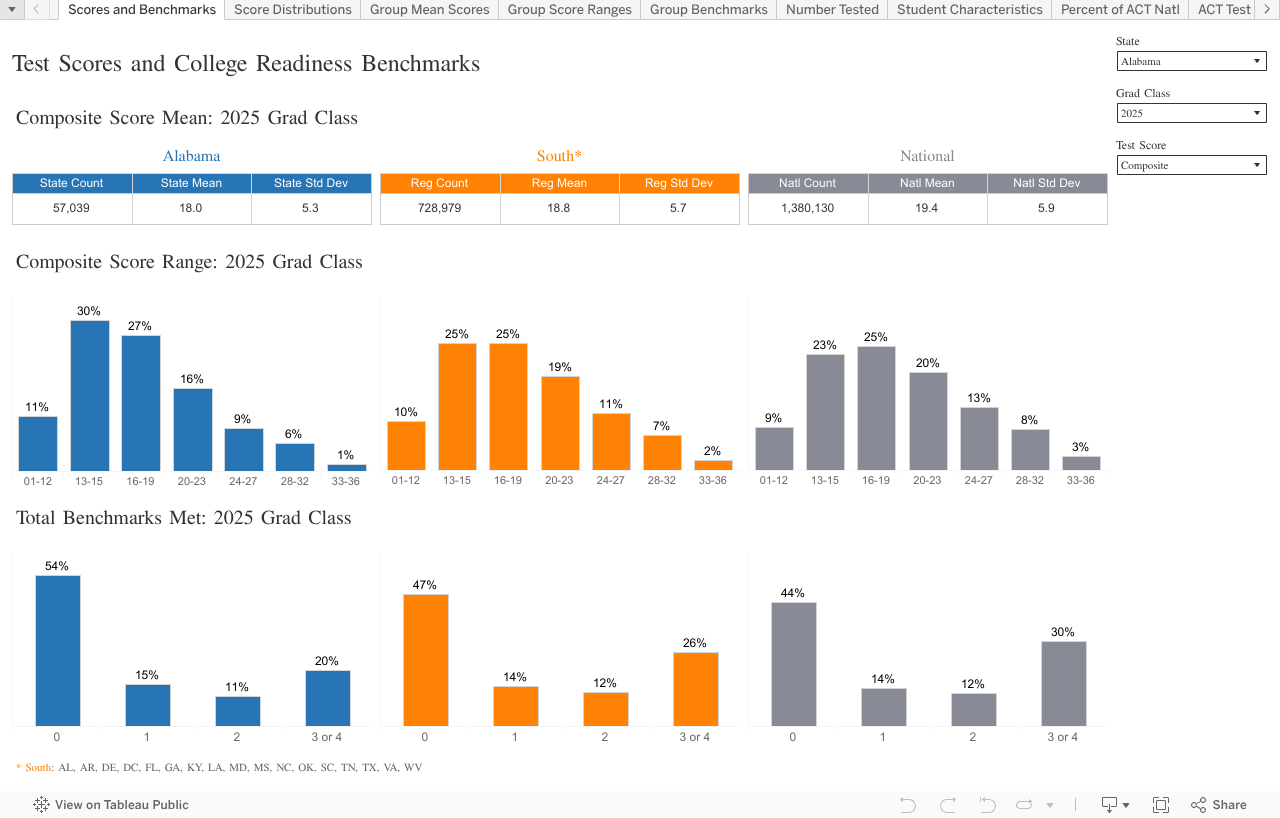
View the Data
The visualization tool below allows users to view multiple measures of college readiness for members of the high school graduating Class of 2025 who took the ACT, summarized by state. Regional and national summaries for each measure of college readiness are also provided for additional context.
For information about accessing and navigating this tool using a keyboard, please see the dashboard help page.
Note: ACT advises discretion when comparing dissimilar populations. Learn about nuances for interpreting the data.
Explore Additional Datasets
- Year-to-year average ACT Composite score changes.
- ACT Composite and ACT Superscore score distributions.
- Career pathway opportunities.
- Industry sector benchmarks and wages.
- College enrollment, persistence, and graduation.
